Spring Mass Damper System
Description of the problem

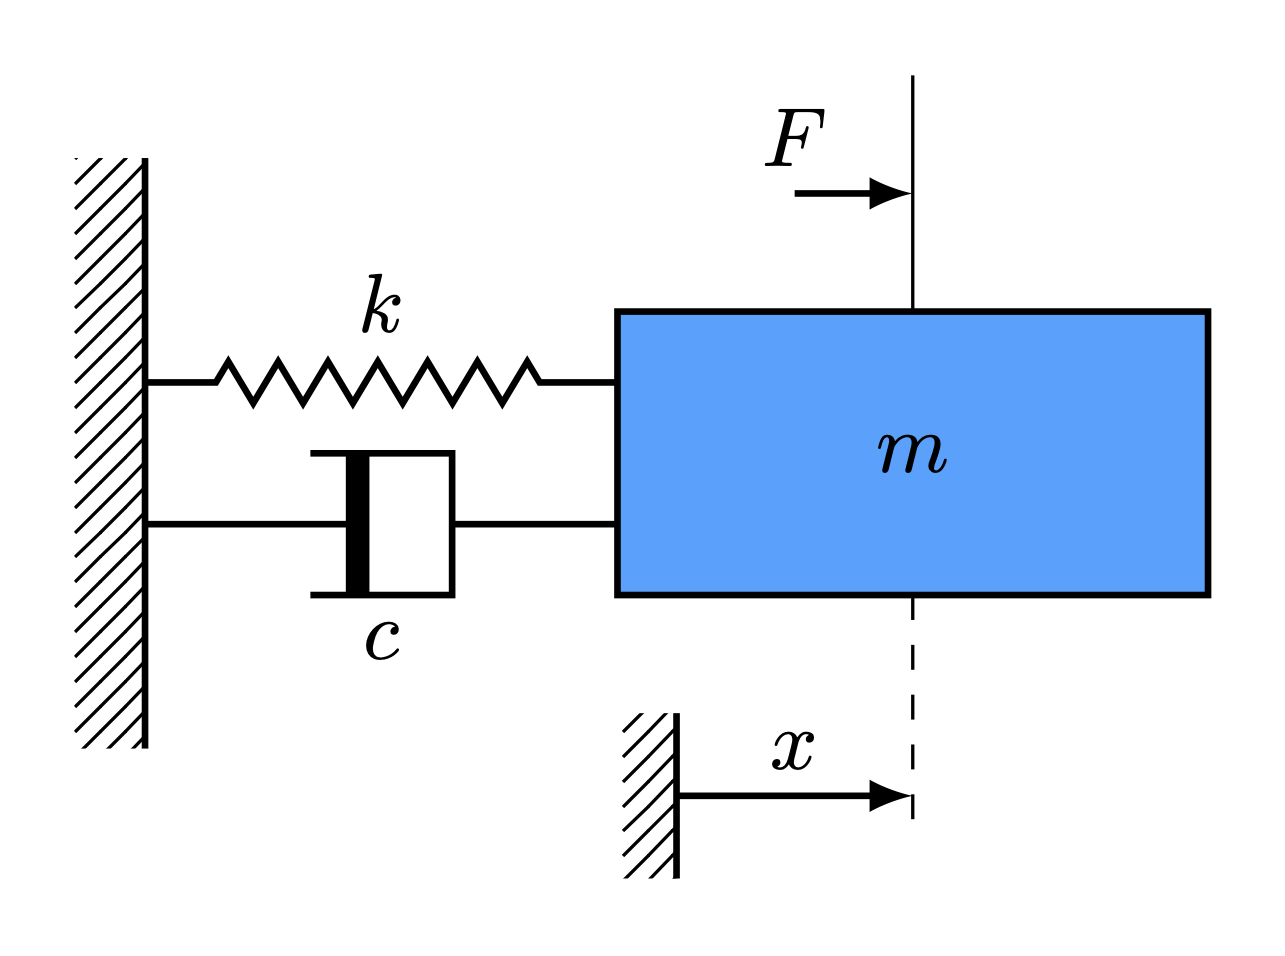
Consider the dynamics of a damped spring mass system governed by a second order differential equation given by
\begin{align} m\ddot{x}(t) + c\dot{x}(t) + kx(t) = F(t) \end{align}
where \(m, c\) and \(k\) are the mass, damping and spring constants. Variable \(x(t)\) represents the displacement of the mass from the equilibrium and the external forcing is denoted by \(F(t)\). In a first-order state-space form with \(x_1 = x\) and \(x_2 = \dot{x}\), the continuous-time model (including its measurement equation) becomes
\begin{align} \dot{\boldsymbol{x}}(t) &= \begin{bmatrix} \dot{x}_1(t)\\ \dot{x}_2(t) \end{bmatrix} = \begin{bmatrix} 0 & 1\\ -\dfrac{k}{m} & -\dfrac{c}{m} \end{bmatrix} \begin{bmatrix} x_1(t)\\ x_2(t) \end{bmatrix} + \begin{bmatrix} 0 \\ 1 \end{bmatrix}F(t) = A_c\boldsymbol{x}(t) + B_cu(t),\\ \boldsymbol{y}(t) &= \begin{bmatrix} 1 & 0 \\ 0 & 1 \end{bmatrix}\begin{bmatrix} x_1(t)\\ x_2(t) \end{bmatrix} = C\boldsymbol{x}(t) + Du(t),\\ \end{align} where \begin{align} A_c = \begin{bmatrix} 0 & 1\\ -\dfrac{k}{m} & -\dfrac{c}{m} \end{bmatrix}, \quad B_c = \begin{bmatrix} 0 \\ 1 \end{bmatrix}, \quad C = \begin{bmatrix} 1 & 0 \\ 0 & 1 \end{bmatrix}, \quad D = \begin{bmatrix} 0 \\ 0 \end{bmatrix}. \end{align} Assuming that \(u(\tau)\) is constant between sample times, i.e. \(u(\tau) = u(k\Delta t)\) for \(k\Delta t\leq \tau < (k+1)\Delta t\), let’s define the discrete-time model \begin{align} \boldsymbol{x}_{k+1} &= A\boldsymbol{x}_{k} + Bu_k,\\ \boldsymbol{y}_{k} &= C\boldsymbol{x}_{k} + Du_k, \end{align} where \begin{align} A = e^{A_c\Delta t}, \quad B_c = \int_{0}^{\Delta t}e^{A_ct}\mathrm{d}tB_c. \end{align} Given a time-history of \(\boldsymbol{x}(t_k)\) and \(u(t_k)\), the objective is to find a realization \((\hat{A}, \hat{B}, \hat{C}, \hat{D})\) of the discrete-time linear model.
Code
The code below shows how to use the python systemID package to find a linear representation of the dynamics of the damped spring mass system.
First, import all necessary packages.
[9]:
import systemID as sysID

import numpy as np
import scipy.linalg as LA

import matplotlib.pyplot as plt
from matplotlib import rc
plt.rcParams.update({"text.usetex": True, "font.family": "sans-serif", "font.serif": ["Computer Modern Roman"]})
rc('text', usetex=True)
plt.rcParams['text.latex.preamble'] = r"\usepackage{amsmath}"
[10]:
m = 1
c = 0.1
k = 1

state_dimension = 2
input_dimension = 1
output_dimension = 2

frequency = 10
dt = 1/frequency
[11]:
Ac = np.array([[0, 1], [-k/m, -c/m]])
Bc = np.array([[0], [1]])

(Ad, Bd) = sysID.continuous_to_discrete_matrices(dt, Ac, Bc=Bc)

def A(t):
    return Ad
def B(t):
    return Bd
def C(t):
    return np.eye(state_dimension)
def D(t):
    return np.zeros([output_dimension, input_dimension])

x0 = np.zeros(state_dimension)
true_system = sysID.discrete_linear_model(frequency, x0, A, B=B, C=C, D=D)
[12]:
total_time_training = 5
number_steps_training = int(total_time_training * frequency + 1)

input_training = sysID.discrete_signal(frequency=frequency, data=np.random.randn(number_steps_training))
output_training = sysID.propagate(input_training, true_system)[0]
[13]:
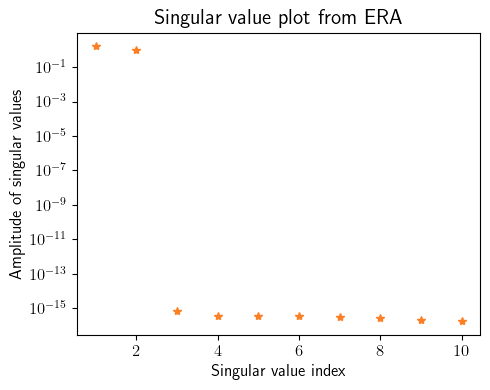
okid_ = sysID.okid_with_observer([input_training], [output_training], observer_order=10, number_of_parameters=50)

p = 20
q = p
era_ = sysID.era(okid_.markov_parameters, state_dimension=state_dimension, p=p, q=q)

fig = plt.figure(num=1, figsize=[5, 4])

ax = fig.add_subplot(1, 1, 1)
ax.semilogy(np.linspace(1, 10, 10), np.diag(era_.Sigma)[0:10], '*', color=(253/255, 127/255, 35/255))
plt.ylabel(r'Amplitude of singular values', fontsize=12)
plt.xlabel(r'Singular value index', fontsize=12)
plt.title(r'Singular value plot from ERA', fontsize=15)
plt.xticks(fontsize=12)
plt.yticks(fontsize=12)

plt.tight_layout()
plt.show()

x0_id = np.zeros(state_dimension)
identified_system = sysID.discrete_linear_model(frequency, x0_id, era_.A, B=era_.B, C=era_.C, D=era_.D)
Error OKID = 2.8876338787766992e-15

[14]:
total_time_testing = 20
number_steps_testing = int(total_time_testing * frequency + 1)
tspan_testing = np.linspace(0, total_time_testing, number_steps_testing)

input_testing = sysID.discrete_signal(frequency=frequency, data=np.sin(3 * tspan_testing))
output_testing_true = sysID.propagate(input_testing, true_system)[0]
output_testing_identified = sysID.propagate(input_testing, identified_system)[0]
[15]:
fig = plt.figure(num=2, figsize=[7, 4])

ax = fig.add_subplot(2, 1, 1)
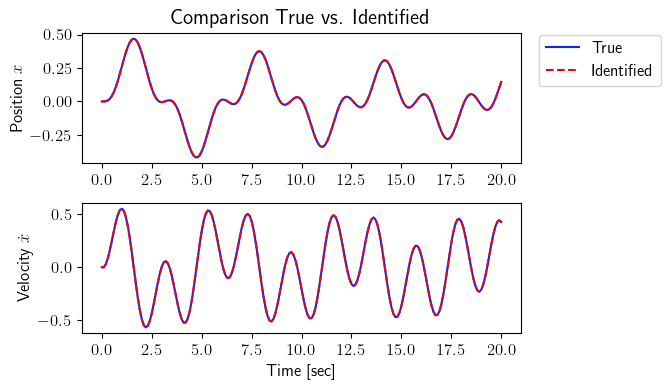
ax.plot(tspan_testing, output_testing_true.data[0, :], color=(11/255, 36/255, 251/255), label=r'True')
ax.plot(tspan_testing, output_testing_identified.data[0, :], '--', color=(221/255, 10/255, 22/255), label=r'Identified')
plt.ylabel(r'Position $x$', fontsize=12)
plt.title(r'Comparison True vs. Identified', fontsize=15)
ax.legend(loc='upper center', bbox_to_anchor=(1.18, 1.05), ncol=1, fontsize=12)
plt.xticks(fontsize=12)
plt.yticks(fontsize=12)

ax = fig.add_subplot(2, 1, 2)
ax.plot(tspan_testing, output_testing_true.data[1, :], color=(11/255, 36/255, 251/255))
ax.plot(tspan_testing, output_testing_identified.data[1, :], '--', color=(221/255, 10/255, 22/255))
plt.xlabel(r'Time [sec]', fontsize=12)
plt.ylabel(r'Velocity $\dot{x}$', fontsize=12)
plt.xticks(fontsize=12)
plt.yticks(fontsize=12)

plt.tight_layout()
plt.show()


fig = plt.figure(num=3, figsize=[7, 2])

ax = fig.add_subplot(1, 1, 1)
ax.plot(tspan_testing, LA.norm(output_testing_true.data - output_testing_identified.data, axis=0), color=(145/255, 145/255, 145/255), label=r'Error')
plt.ylabel(r'2-norm error', fontsize=12)
plt.xlabel(r'Time [sec]', fontsize=12)
plt.title(r'Error True vs. Identified', fontsize=15)
ax.legend(loc='upper center', bbox_to_anchor=(1.18, 1.05), ncol=1, fontsize=12)
plt.xticks(fontsize=12)
plt.yticks(fontsize=12)

plt.tight_layout()
plt.show()


[16]:
ev_true = LA.eig(A(0))[0]
ev_identified = LA.eig(era_.A(0))[0]
print('True eigenvalues:', ev_true)
print('Identified eigenvalues:', ev_identified)

fig = plt.figure(num=4, figsize=[6, 4])

ax = fig.add_subplot(1, 1, 1)
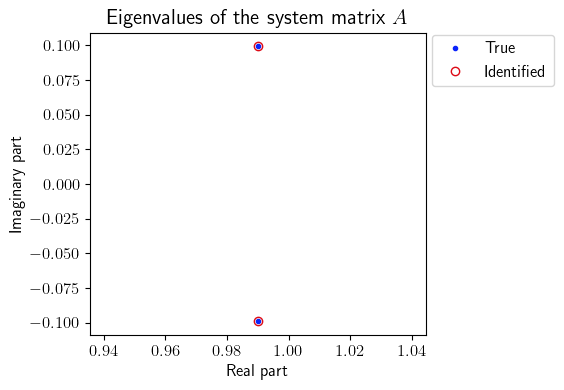
ax.plot(np.real(ev_true), np.imag(ev_true), '.', color=(11/255, 36/255, 251/255), label=r'True')
ax.plot(np.real(ev_identified), np.imag(ev_identified), 'o', mfc='none', color=(221/255, 10/255, 22/255), label=r'Identified')
plt.ylabel(r'Imaginary part', fontsize=12)
plt.xlabel(r'Real part', fontsize=12)
plt.title(r'Eigenvalues of the system matrix $A$', fontsize=15)
ax.legend(loc='upper center', bbox_to_anchor=(1.2, 1.02), ncol=1, fontsize=12)
plt.xticks(fontsize=12)
plt.yticks(fontsize=12)

plt.tight_layout()
plt.show()
True eigenvalues: [0.99005398+0.09921166j 0.99005398-0.09921166j]
Identified eigenvalues: [0.99005398+0.09921166j 0.99005398-0.09921166j]
